How to Read Forex Chart Patterns in 2026
Updated November 28, 2024


All products and services featured are independently selected by WikiJob. When you register or purchase through links on this page, we may earn a commission.
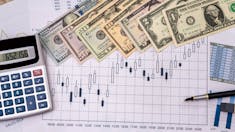
Forex (an abbreviation of foreign exchange) relates to the process of purchasing and selling different currencies within the foreign exchange market. Forex is sometimes referred to as ‘the currency market’ or ‘FX’.
In the international forex market, investors, shareholders and retailers influence the relative value for converting one currency into another by acquiring and trading currency pairs. Successful forex traders benefit from the changes in value between different international currencies by choosing two currencies and predicting which will go up in value compared with the other.
Forex charts can be used to provide an illustration of a currency’s behaviour or performance over time. Traders often use forex charts to help them to gain a better understanding of past performance; this information is then used to help them make informed trading decisions in the future.
Since forex charts can signal uptrends and downtrends in currency performance, they can be a helpful resource when it comes to planning your next trading move.
A list of the Top Forex and CFD Brokers for January 2026:
Description of the Best Forex and CFD Brokers for January 2026
1. Pepperstone
Pros
- Extensively regulated
- No minimum deposit
- Low fees and mostly free withdrawals
- Good customer service
Cons
- No investor protection for clients outside UK, EU and EEA
- Withdrawal fee for international bank wires
- CFDs only
Pepperstone is known for its robust forex trading services, and its forex charting tools are a key component of its offerings.
Both MT4 and MT5 platforms are equipped with advanced charting tools. They offer multiple chart types (line, bar, candlestick), various time frames (from one minute to monthly), and the ability to overlay multiple charts.
TradingView is famous for charting. Pepperstone offers a free TradingView subscription for additional charting tools.
Traders have access to a wide range of technical indicators and drawing tools for detailed market analysis. This includes trend lines, Fibonacci retracements, moving averages, and oscillators like RSI and MACD.
Users can customize charts extensively, including color schemes, chart types, and the ability to save templates for future use.
Pepperstone’s forex charting tools are comprehensive, advanced, and user-friendly, making them suitable for both novice and experienced traders.
By offering multiple platforms with extensive charting capabilities and technical analysis tools, Pepperstone enables traders to analyze the forex market effectively and execute their trading strategies efficiently.
2. eToro
Pros
- Regulated by FCA, ASIC
- No withdrawal fee for US clients
- 0% commission on stocks
- Social and copy trading
Cons
- Not available in every US State
- More expensive than most of its competitors
- No MetaTrader platforms
The below does not apply to US users
Founded in 2007, eToro is considered a very low-risk broker as it is highly regulated by the Financial Conduct Authority (FCA) in the UK and many other regulatory bodies elsewhere.
Opening an account is free and you can access a $100,000 demo account to test the system.
It offers 47 currency pairs for trading. Spreads for forex trading have recently been significantly reduced and range from a very competitive 1 to 3 pips for major currency pairs.
Typical spreads for EURUSD and USDJPY trades, for example, are just 1 pip.
You can see the full list of spreads on the eToro website.
You’ll need to deposit a minimum of $200 for Copy Trading, eToro's standout feature which allows you to follow other traders and copy their trades.
This forex broker is great for beginners due to its user-friendly interface and app and 24-hour customer support. It allows you to trade currencies, stocks and cryptocurrencies in one portfolio and the Copy Trading system is a great way to learn.
The company also offers trading courses and features a Learning Lab which houses a variety of tools to support clients with their trading experience.
61% of retail investor accounts lose money when trading CFDs with eToro. You should consider whether you understand how CFDs work, and whether you can afford to take the high risk of losing your money.
3. AvaTrade
Pros
- Trading signals and strategies
- Automated trading
- User-friendly interface
- Variety of trading pairs
- Transparency
Cons
- Reliance on signals
- Subscription cost
AvaTrade is widely recognized as one of the best Forex and CFD trading brokers, offering a comprehensive suite of features and services tailored to meet the needs of traders worldwide.
When it comes to forex charts and chart patterns, AvaTrade provides traders with powerful tools and resources to analyze the markets effectively.
AvaTrade offers advanced charting tools that enable traders to analyze forex markets with precision. Traders have access to a wide range of technical indicators, drawing tools, and chart types, allowing them to customize their charts according to their trading strategies and preferences.
AvaTrade allows traders to view forex charts across multiple time frames, from minutes to months. This flexibility enables traders to analyze price action and identify trends over different time horizons, helping them make informed trading decisions.
AvaTrade provides real-time market data, ensuring that traders have access to up-to-date information on currency pairs and CFDs. This allows traders to react quickly to market developments and capitalize on trading opportunities as they arise.
AvaTrade's charting tools include features for recognizing common chart patterns, such as head and shoulders, triangles, flags, and channels. These patterns can provide valuable insights into market sentiment and potential price movements, helping traders identify entry and exit points for their trades.
AvaTrade offers a wealth of educational resources on forex charts and chart patterns, including tutorials, webinars, and trading guides. These resources help traders understand how to interpret charts effectively and identify profitable trading opportunities based on chart patterns and technical analysis.
AvaTrade's trading platforms, including MetaTrader 4 (MT4) and AvaTradeGO, seamlessly integrate charting tools and analysis features, making it easy for traders to access and analyze forex charts while executing trades on the same platform.
4. Plus500
Pros
- No buy/sell commissions and tight spreads
- Leverage of up to 1:30
- FREE unlimited Demo
- 2,800+ CFD trading instruments
- Real-time quotes and advanced analytical tools
- Fast and reliable order execution
Cons
- No API integrations
- No social copy trading
Plus500 instruments are available for trading exclusively via CFDs and the service offered on the platform is CFD-based.
Another user-friendly entry on our list of the best forex and CFD brokers in the UK is Plus500, providing an easy-to-use and accessible service.
You’ll find over 60 CFD currency pairs with competitive spreads, no commission and available leverage of up to 1:30.
Although MetaTrader and cTrader are not available, Plus500’s own platform is very user-friendly. It comes with a range of intuitive risk management features and is available on web and mobile.
Plus500 requires a minimum deposit of £100 if using a credit or debit card, and £500 if using bank transfer.
Plus500 UK Ltd authorized & regulated by the FCA (#509909).
5. IG
Pros
- Highly regulated
- MetaTrader 4 (MT4)
- Over 10,000 instruments
- Available in the UK and US
- 24/7 customer support
Cons
- High fees
- No deposit compensation scheme for US accounts
- No copy trading
- Inactivity fees
IG is a great share trading platform for beginners thanks to its user-friendly interface and extensive educational resources.
Pros of IG include a wide range of trading instruments and markets, as well as the ability to access multiple account types and trading platforms. The platform also offers a demo account for beginners to practise trading strategies before investing real money.
However, IG isn’t the cheapest share trading platform, with relatively high trading fees and a minimum deposit requirement of £250 when paying by credit/debit card or PayPal.
In terms of additional fees, IG charges a commission fee for share trading, starting from £8 per trade. There’s also a custody fee of 0.25% per year for holdings of £250 or more.
Overall, IG is a solid choice for beginners looking for a user-friendly platform with extensive educational resources, but investors should be aware of its fees and minimum deposit requirements.
6. Saxo
Pros
- Heavily regulated
- Good product portfolio
- Low forex fees
- No withdrawal or inactivity fees
Cons
- Does not accept US clients
- High fees for options, futures and bonds
Saxo provides sophisticated forex charting tools that are integral for traders looking to analyze market trends and make informed trading decisions.
Saxo’s platforms, SaxoTraderGO and SaxoTraderPRO, offer advanced charting tools that enable detailed market analysis. These tools include a wide range of technical indicators, chart patterns, and overlay functions that can assist traders in identifying trading opportunities and trends within the forex market.
Saxo’s forex charts are highly customizable. Traders can adjust settings to fit their personal preferences or trading strategies, including changing time frames, chart types, and indicators. This level of customization allows traders to set up their charts in a way that best suits their analysis technique.
Saxo provides real-time data feeds on its forex charts, ensuring traders have access to the latest market prices and movements. This is crucial for forex trading, where the market is highly dynamic and conditions can change rapidly.
Access to historical forex data allows traders to perform backtests of trading strategies against past market behavior. This is an essential feature for traders who use technical analysis as a core component of their trading strategy.
From the chart interface, Saxo allows traders to execute trades directly. This feature enables traders to react quickly to market movements without switching between screens or platforms, enhancing trading efficiency.
Saxo provides extensive educational materials to help traders learn how to effectively use forex charts. This includes tutorials and webinars focusing on chart analysis, which are beneficial for both novice and experienced traders.
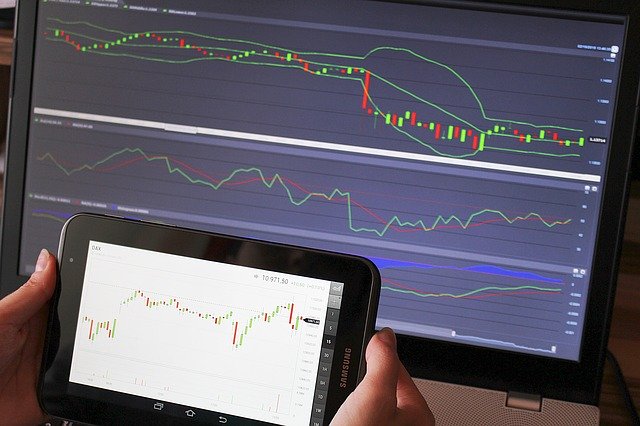
How to Access Forex Charts
If you want to get started with forex trading, you will soon come to realise the importance of tracking currency movements. One of the most effective ways to achieve this is by using forex charting software.
There are many different options available, so it's important to look for one that will suit your skill level and trading style.
One of the most popular forex trading software solutions is TradingView. This software offers a free basic solution which can be used to trade any market. It is cloud-based, so you can access it from any device.
TradingView is designed to meet the needs of new and experienced traders alike. There are plenty of customisation options to ensure it meets your needs and you can set up alerts to prompt you when your favourite currency pairs begin to move.
If you would prefer to use an ad-free service, there are three different paid-for options which offer a range of additional benefits.
How to Read Forex Charts
Forex charts can help traders to recognise patterns, gain an understanding of how many traders are trading in a market and identify areas of support and resistance.
Choosing a timeframe is one of the most important aspects of reading forex charts. To toggle between timeframes, zoom in and out of the chart. Time is represented on the ‘x’ axis and exchange rate pricing on the ‘y’ axis. To view historical data, move to the left of the chart.
In simple terms, a downtrend can be identified by looking for a line that moves downwards from left to right, whereas an uptrend is depicted by a line moving upwards from left to right.
The three main charts used in forex trading are:
Step 1. Line Charts
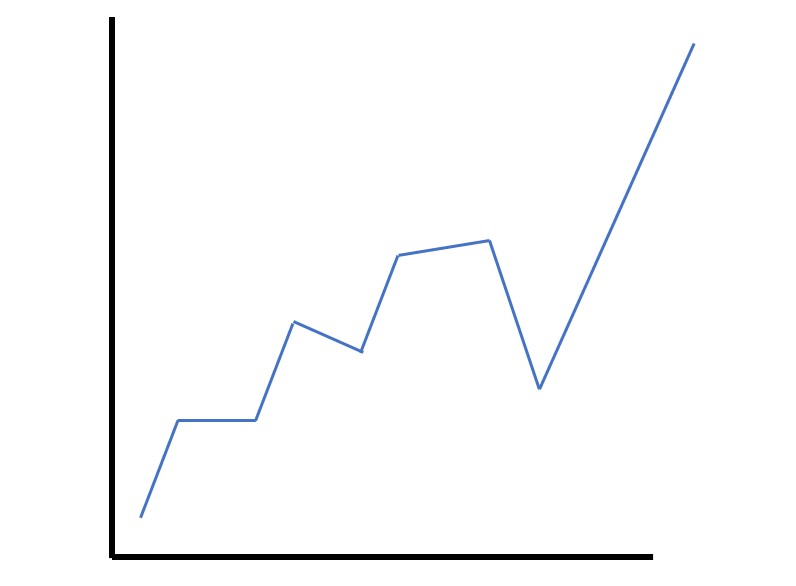
These are the most straightforward type of forex chart to read so they are a good starting point for new traders. However, they don’t give as much information as some of the other chart types.
A line chart is simply a line between one closing price to the next. It can give traders an overall feel for how a currency pair has performed during a specific timeframe.
Step 2. Bar Charts (sometimes called OHLC (Open, High, Low, Close) Charts)
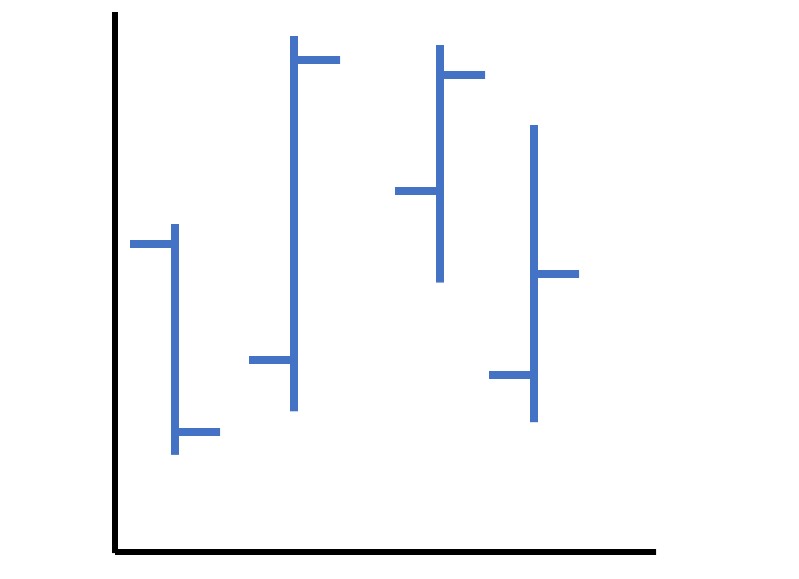
A bar forex chart gives traders a little more information than a line chart. They show closing prices but, at the same time, they also give low and high indications of opening prices.
Within each bar, the lowest part of the vertical line represents the lowest traded price for the specified currency pair during a certain timeframe. Similarly, the highest part of the line shows the highest traded price during the same timeframe.
Each of the vertical lines meets with two shorter horizontal lines. The one on the left-hand side shows the opening price for the chosen currency pair at a specific time; the one on the right-hand side shows the closing price for the currency pair at that time.
Step 3. Candlestick Charts
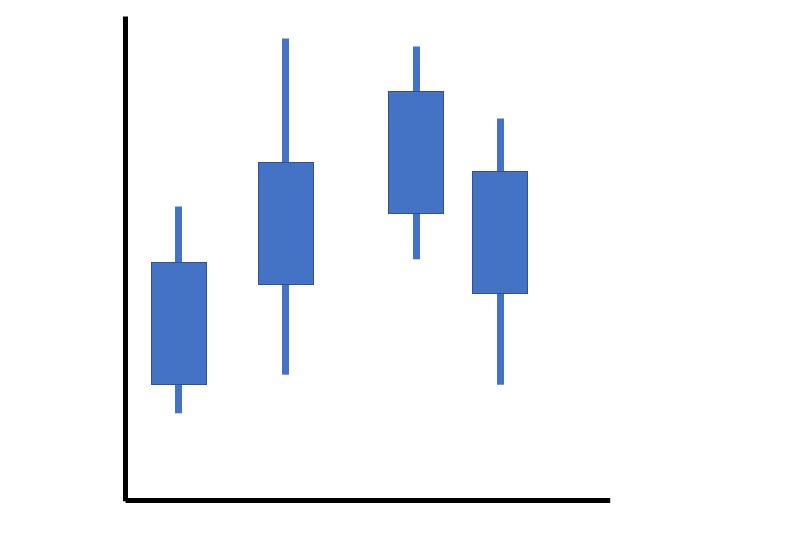
The candlestick chart has Japanese origins and is probably the most useful of the three main chart types.
When reading a candlestick chart, it is important to understand the basic candle structure. Each candlestick represents a timeframe – this could be anything from one minute to an entire week.
Irrespective of the timeframe, a candlestick symbolises the following values:
- Opening price at the start of the chosen timeframe
- Closing price at the end of the chosen timeframe
- Peak price within the chosen timeframe
- Lowest price within the chosen timeframe
According to the opening and closing price, the candlestick can be used to decide whether a session finished ‘bearish’ or ‘bullish’:
- Bullish – The closing price was greater than the opening price
- Bearish – The closing price was less than the opening price
Common Chart Patterns
When reading forex charts, it is important to be aware of some of the most popular forex chart patterns and trends you might observe and what they might indicate in terms of future prices. These signals include reversal and continuation trends:
Reversal
During a reversal trend formation, you might spot one or more of the following patterns:
Double Top:
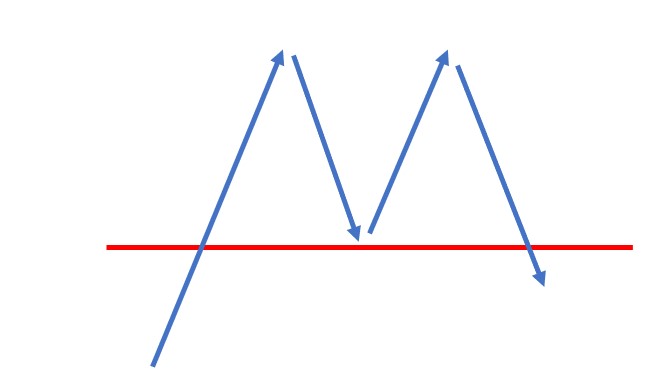
Look out for an ‘M’ shape with two ‘tops’ or peaks. Typically forming during an uptrend, a double top is a very bearish pattern which forms when the price reaches a particular level more than once but doesn’t go above it.
After this level has been reached, the price tends to dip slightly before returning back up to the top level again. If it bounces back down again, this is known as a double top. After reaching the second top, it is likely that the price will dip again.
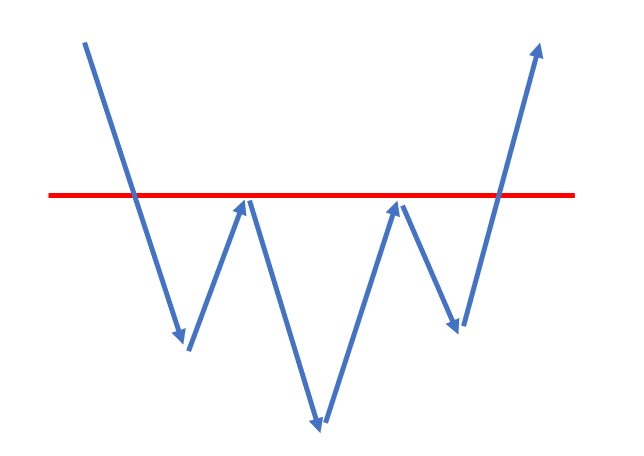
Double Bottom:
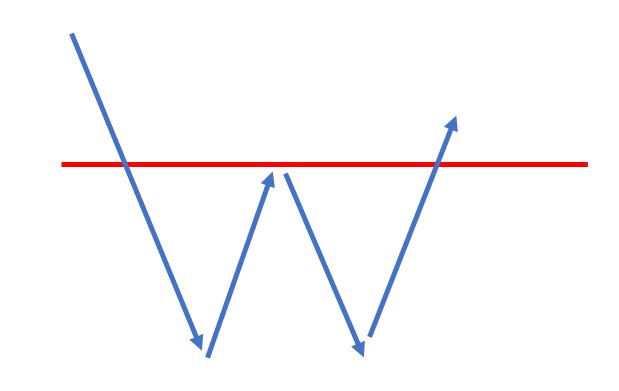
Look out for a ‘W’ shape with two low points. This bullish forex chart pattern is usually seen following a downtrend – the price will drop down to a new low, increase slightly and then dip back down to the lowest point. After reaching the second low point, it is likely that the price will increase again.
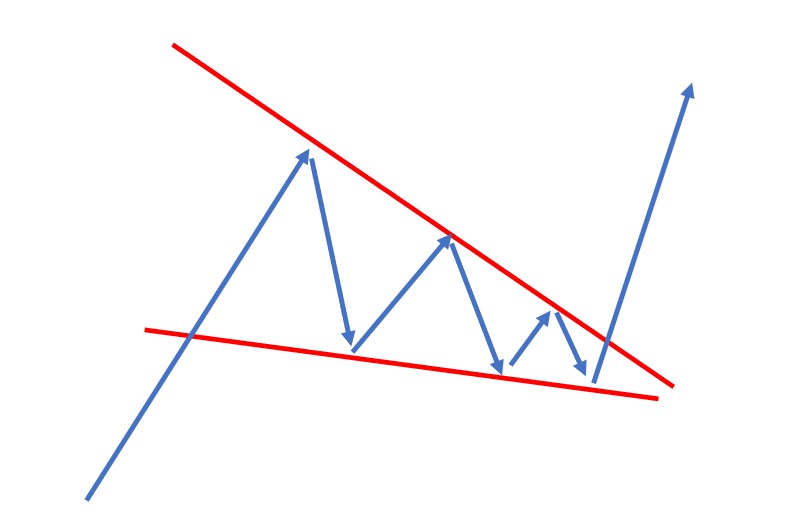
Head and Shoulders:
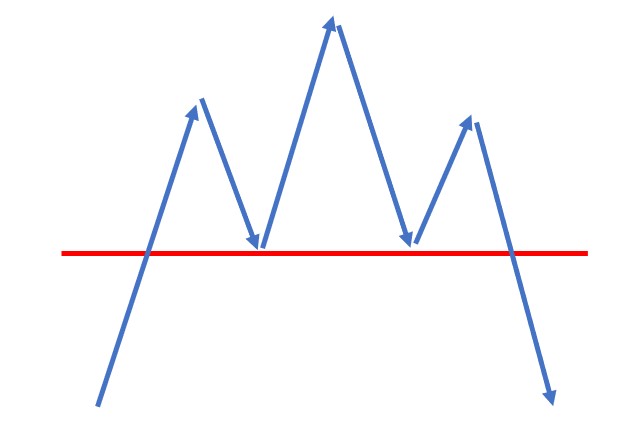
In this relatively unusual bearish pattern, you’ll see an initial peak (shoulder), a slight dip followed by an even higher peak (head), another slight dip and, finally, one further peak (shoulder). The lowest points of the two troughs can be connected to form a ‘neckline’. After the second peak, it is likely that the price will fall.
Inverse Head and Shoulders:
In contrast to the standard head and shoulders pattern, the inverse version is bullish. Look out for an initial dip, a slight increase followed by an even lower dip, another slight increase and finally a further dip that is not as low as the middle one. After the second dip, it is likely that the price will rise again.
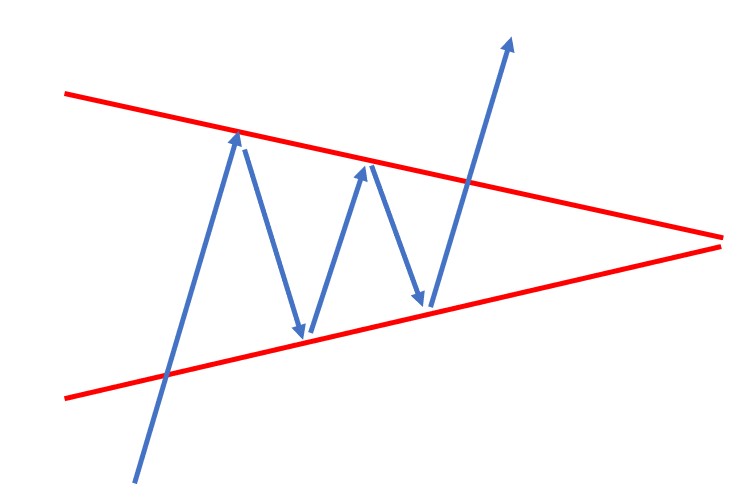
Rising Wedge:
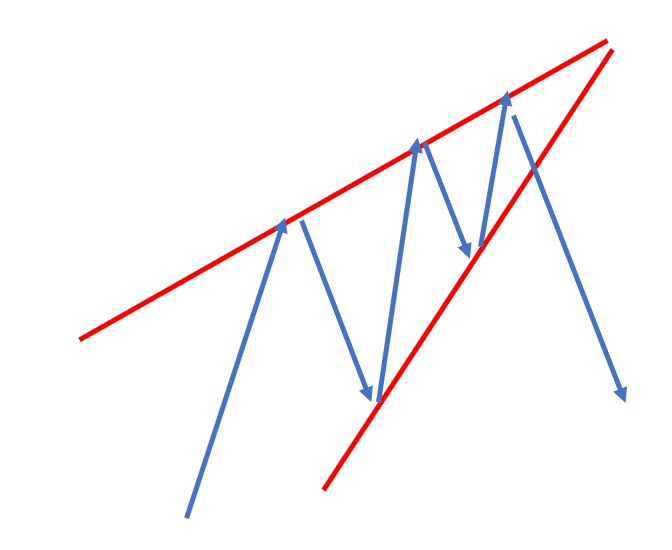
Sometimes called the ascending wedge, this bearish pattern often forms during an uptrend and can signify either a reversal or continuation trend. Look out for the price consolidating between rising sloping support and resistance lines. If this pattern shows just after an uptrend it usually indicates a reversal pattern, so you can expect the price to start dropping again.
Continuation
During a continuation trend formation, you might spot one of the following patterns:
Rising Wedge:
If you spot this forex chart pattern after a downtrend, it’s likely that the price will continue to drop.
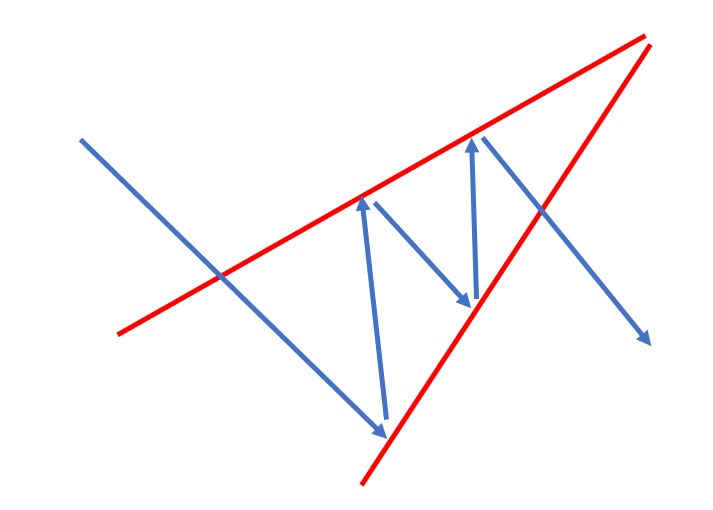
Falling Wedge:
Just like the rising wedge, the falling wedge can indicate either a reversal or continuation trend. If it forms at the end of a downtrend, this bullish pattern indicates that an uptrend can be predicted. If it forms during an uptrend, the price can be expected to continue increasing.
Bearish Rectangle:
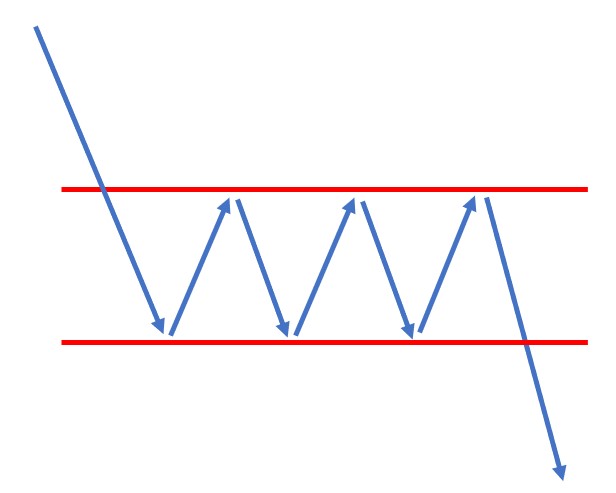
Rectangle patterns appear when the support and resistance levels of the price are parallel. You’ll notice the price ‘testing’ both the support and resistance levels a few times before finally breaking out. A bearish rectangle appears when the price increases for a period during a downtrend. If you spot this pattern, you can expect that the price will continue to fall.
Bullish Rectangle:
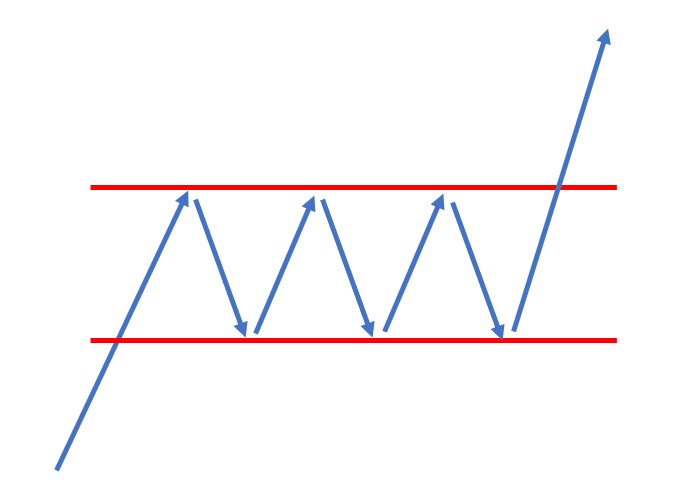
A bullish rectangle appears following an uptrend. If you spot this pattern, you can expect the price to continue going up.
Bearish Pennant:
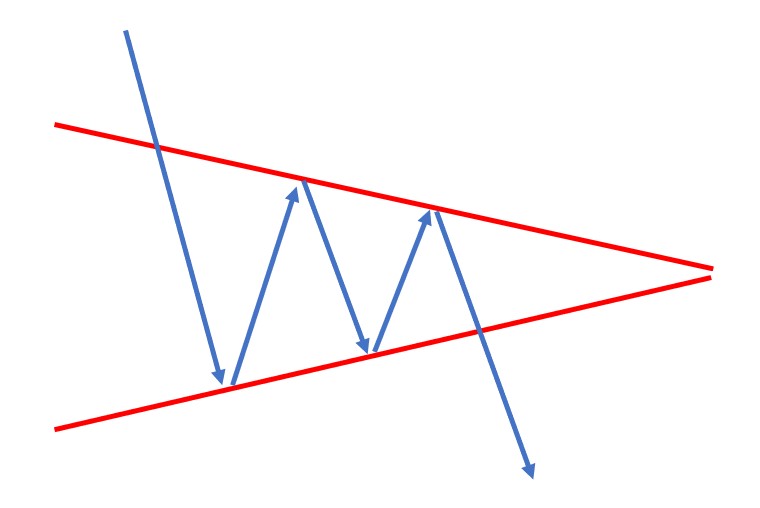
Following a significant upward or downward move in price, there is usually a short pause before further movement in the same direction. As a result, the price tends to consolidate. In a forex chart, this can be identified by a small symmetrical triangle shape called a pennant.
Bearish pennants form during vertical, steep downturns. Following a sudden drop in price, some traders will choose to close their positions whereas others opt to join the trend, meaning that the price consolidates for a short time.
Once enough sellers have moved into the trade, the price drops below the bottom point of the pennant and it can be expected to continue moving down.
Bullish Pennant:
Bullish pennant patterns are the opposite of bearish ones, so they appear after a sharp increase in price. This uptrend can be expected to continue after a brief period of consolidation.
Triangles:
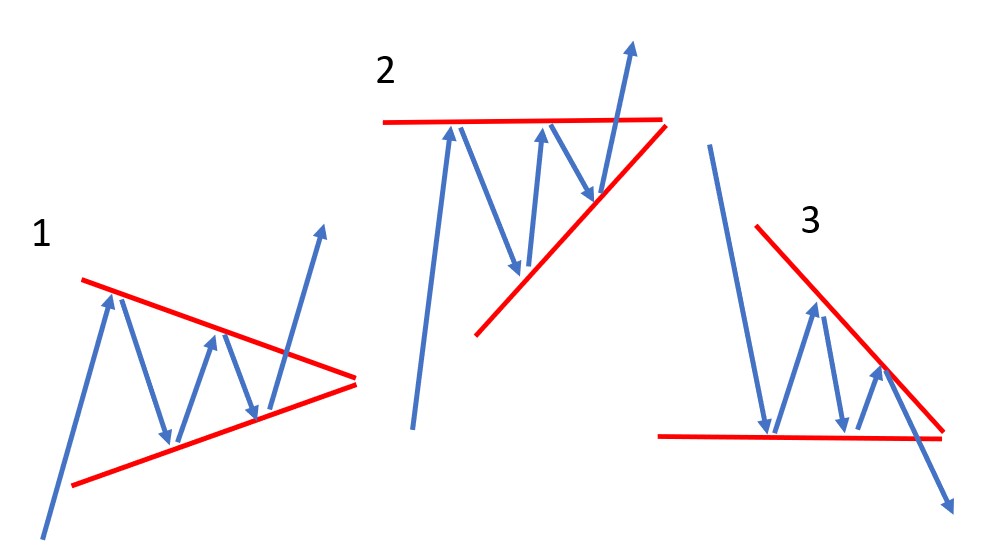
When a triangle pattern appears, it can be more difficult to predict what will happen next. There are three different types of triangle chart formation to look out for:
- Symmetrical triangle: In this pattern, the incline of the price’s highs and the decline of the price’s lows come together to create a pattern resembling a triangle. It’s impossible to predict which direction the market will eventually break out in.
- Ascending triangle: In this pattern, there is a clear point of resistance, but the lows can be observed as increasing.
- Descending triangle: This pattern is the opposite of an ascending triangle – there is a support level line which the price doesn’t seem to be able to break and a series of lower highs creates the upper line of the triangle.
Chart patterns are a useful tool when it comes to making predictions about the markets and highlighting areas which are potentially beneficial for trading.
While chart patterns can be useful in providing an insight as to what the markets are doing, they shouldn’t be used by themselves. Ideally, they should be considered alongside other data to help build strategies and make trading decisions.
Chart patterns and price action patterns are more useful in stocks and futures markets than in Forex markets. This doesn’t mean that they aren’t helpful for making Forex decisions, however, they should just be considered alongside other information.
Candlestick charts are particularly useful as they help to highlight changes within specific periods. This is useful for forex trades which often take place over a period of time.
Many brokers will offer educational tools as part of their packages which will enable you to learn about things like reading charts and patterns.
Alternatively, there are several courses and training programs to consider.
They offer an insight into gradual changes within markets which can’t always be seen immediately. This information can help to influence decisions regarding how and when to make trades.
Support and resistance help brokers to see potential highs and lows within the market as well as offer the ability to see where they are likely to sit within these trends.
This is a pattern that often happens at the top of a market and can often signal a reversal. It is a relatively rare pattern to see in charts and is similar to the more common head and shoulders pattern.
Final Thoughts
For any new trader, forex charts are likely to seem overwhelming when you first start looking at them. One of the best things you can do is set aside some time to gain a good understanding of how the price and time axis can be used to help gather historical data and learn how this can be used to predict what might happen next.
Many trading platforms offer the option to open a demo account which will allow you to trade risk-free before putting any of your money at risk. This is a good way to boost your overall trading knowledge and give yourself time to become familiar with forex charts, interpret patterns and act upon any trends that you identify.
WikiJob does not provide tax, investment or financial services and advice. The information is being presented without consideration of the investment objectives, risk tolerance or financial circumstances of any specific investor and might not be suitable for all investors. Past performance is not indicative of future results. Investing involves risk including the possible loss of principal.