What Is Price Action Trading? (2024 Guide)
Updated December 13, 2023


All products and services featured are independently selected by WikiJob. When you register or purchase through links on this page, we may earn a commission.
76% of retail investor accounts lose money when trading CFDs with eToro. You should consider whether you understand how CFDs work, and whether you can afford to take the high risk of losing your money. Don’t invest unless you’re prepared to lose all the money you invest. This is a high-risk investment and you should not expect to be protected if something goes wrong. Take two mins to learn more.
- A list of the Top Brokers for Price Action Trading in April 2024:
- Description of the Best Brokers for Price Action Trading in April 2024
- What Is Price Action Trading?
- Advantages of Price Action Trading
- Profiting from Price Action Trading
- What Drives Price Action Volatility?
empty
empty
empty
empty
- The Four Pillars of Price Action
empty
empty
empty
empty
- Price Action Patterns
empty
empty
empty
empty
empty
- Final Thoughts
A list of the Top Brokers for Price Action Trading in April 2024:
Description of the Best Brokers for Price Action Trading in April 2024
1. eToro
eToro is best known for being a social trading specialist. This Israeli fintech startup has a lot to offer beginner traders.
The simple account setup and great training available with eToro make this a popular choice for those looking for a simple trading platform offering a wide range of trading instruments without too many complicated tools.
eToro has relatively low fees, and the minimum deposit to start is just $200. This platform uses USD as the base currency, so all deposits and withdrawals need to be made in USD, and there is a $5 withdrawal fee.
eToro offers traders the opportunity to not only copy the trading actions of successful traders but also the ability to completely copy their portfolio.
To find out more, read our eToro review.
76% of retail investor accounts lose money when trading CFDs with eToro. You should consider whether you understand how CFDs work, and whether you can afford to take the high risk of losing your money. Don’t invest unless you’re prepared to lose all the money you invest. This is a high-risk investment and you should not expect to be protected if something goes wrong. Take two mins to learn more.
2. IG
IG is a great share trading platform for beginners thanks to its user-friendly interface and extensive educational resources.
Pros of IG include a wide range of trading instruments and markets, as well as the ability to access multiple account types and trading platforms. The platform also offers a demo account for beginners to practise trading strategies before investing real money.
However, IG isn’t the cheapest share trading platform, with relatively high trading fees and a minimum deposit requirement of £250 when paying by credit/debit card or PayPal.
In terms of additional fees, IG charges a commission fee for share trading, starting from £8 per trade. There’s also a custody fee of 0.25% per year for holdings of £250 or more.
Overall, IG is a solid choice for beginners looking for a user-friendly platform with extensive educational resources, but investors should be aware of its fees and minimum deposit requirements.
3. Admiral Markets
Founded in 2001, Admiral Markets is headquartered in the UK and regulated by both the FCA and CySEC.
Using MT5, traders get access to hundreds of trading instruments for forex and CFD trading, where strategies like scalping and hedging are welcome.
The minimum deposit is set at $200 (or equivalent in local currency), and there are no deposit, withdrawal or inactivity fees.
Admiral Markets offers unbeatable customer support and more than 21 years of trusted history as a broker, which makes it a great choice for beginner traders.
If you are not a UK resident, the conditions might change depending on the regulation. Please, check the Admirals website for details.
Please, be aware that if you want to see UK conditions but you don't have a UK IP address, then you must select Admirals Markets UK at the bottom of the home page.
What Is Price Action Trading?
Price action trading uses movement in the price of forex, stocks, bonds or any other tradable security as a strategy to make a profit.
In some ways, trading concerns price action; finding the appropriate time to buy or sell depending on the movement of price.
However, the specific strategy of price action trading means discovering order throughout the random movement of an asset price. Price movement plotted over time forms the basis for almost all technical analysis.
The movement of price can form patterns.
Short to medium-term traders ‘read the market’ to discover formations, trends or patterns that help formulate trading decisions.
These decisions tend to be subjective, and traders will not repeat the same decisions even when presented with identical data.
Price action trading is often used by retail traders, speculators, arbitragers and trading firms by using technical analysis tools to monitor the up and down movement of a security’s price.
Price action trading relies on volatility to present opportunities, so any asset class that can be volatile is an opportunity to use price action trading.
This includes:
- Equities
- Bonds
- Commodities
- Forex
- Derivatives
Advantages of Price Action Trading
For short to medium-term limited profit trades, price action trading is a popular option. Long-term traders use other strategies for profit.
Finding a strategic way to comprehend the seemingly random movement of prices is important.
For those that use a price action trading strategy, the combination of technical analysis tools and recent price history that helps to identify trade opportunities based on the trader’s interpretations has some great advantages.
For traders, self-defined strategies offer flexibility and ease of application. Price action trading can be used with trading portals as well as software and applications to be used by novice and experienced traders.
Price action trading is closest to floor trading in the exchanges than any other strategy.
Price action trading is easy to test in a demo account or through backtesting on past data. It is time-tested to be usable in any market condition.
It is also a clearly defined strategy with no grey areas; the conditions are either there or not there – there is no ambiguity. This reaction to price changes maintains an objective market mindset and encourages the discipline needed to make good decisions.
Profiting from Price Action Trading
Price action trading relies on volatility in the market to make a profit. If the prices do not change, then there are no profits to be made.
In a volatile market, prices can alter fast in a short period, and to profit, you need to know which side of the trade to be on.
If prices are rising, then buying at the right time can generate a profit, whereas if prices are falling, then selling at the right time can make a profit.
What Drives Price Action Volatility?
Political and Economic News
Prices on shares, bonds, commodities, forex and other tradable assets can change depending on news from political and economic sources.
When volatility is created through the news, almost all markets can be affected, both positively and negatively.
Rumor
Markets are not immune to rumors, and when messages are passed, they can impact prices.
A notion as simple as an idea that a country is losing trade deals, for example, could cause the value of their currency to plunge.
Rumors of this happening might encourage prices to drop as a result of more people selling.
Driven by a Universal Conclusion
If many traders recognize a pattern coming through on recent prices, then the self-fulfilling prophecy of their actions could create volatility in the market.
Many traders employing the same buying or selling moves can drive the price up (or down).
Adverse Events
Aside from political and economic news and rumors, markets can be affected by adverse events, such as natural disasters.
The value of stock invariably goes down, and other more long-term financial effects make the market more volatile.
The Four Pillars of Price Action
Identifying price action to trade means understanding the ‘pillars’ that make up the technical analysis tools that are used to identify trade opportunities.
There are certain parts of a graph that might seem complicated; however, when fully understood, they can be used to demonstrate how the market is performing.
Candlesticks
Candlesticks are the most popular form of charting.

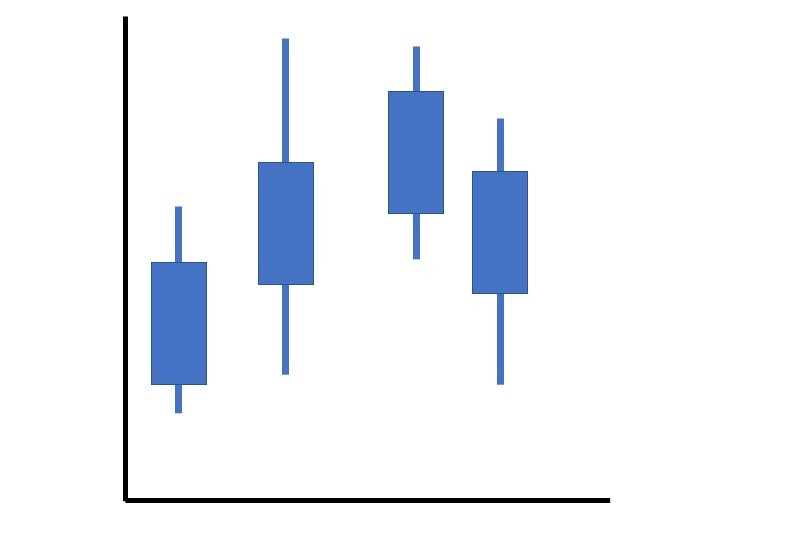
As an image, the candlestick is a thick bar with a ‘wick’ at either end. The top and bottom of the thick bar represent the opening and closing price for the day.
The top wick points to the highest point for the day, while the bottom wick points to the lower point for the day.
In most charts, they are black (or red) for closing lower than the opening; and white (or green) if they closed higher than they opened.
Each candle relays important information, but more data can be gathered when they are grouped and read over some time.
Flat Trend
In general, most markets are flat. There are no significant movements in price, even during volatile times.
Flat markets encourage small profits, and these tight ranges mean buying low and selling high with notable gains is unlikely.
Bullish Trend
A bullish trend in the market can be identified by a grouping of candles that extend up and to the right.
This means that the prices are rising, closing higher daily. To be a true bullish trend, any reversal of the trend is not below the original high.
Bearish Trend
The opposite of a bullish trend, a bearish trend is a grouping of candles heading downwards.
Bearish trends are not generally good news for retail traders unless their strategy includes short-selling assets.

Price Action Patterns
There are a few patterns that price action traders look for when deciding when to make a trade. These develop over a period of days.
Bullish Engulfing
A bullish engulfing pattern is a downturn reversal which is more than just a bullish trend.
When looking at the pattern, a white candlestick follows a black candlestick. The white candlestick closes higher than the previous day’s opening after opening lower than the previous days close; therefore, it completely overlaps or engulfs the previous day’s candlestick.
What makes this a good pattern is that the white candlestick has a small or non-existent upper wick. The price closed at or near the highest price for the day, therefore, so the price is likely to continue moving upwards.
The bullish engulfing pattern is one that analysts tend to take notice of because it indicates a good time to buy, representing a change in sentiment for that commodity.
Bearish Engulfing
The bearish engulfing pattern is the direct opposite. This is where a larger black candlestick fully engulfs a preceding white candlestick by closing lower than the previous day’s opening and opening higher than the previous day’s close.
Bearish engulfing patterns demonstrate that the sellers are overtaking the buyers and represent a reversal of an uptrend. Prices are being pushed down, and this is a good shorting opportunity if that is a strategy used by traders.
In regards to bullish and bearish engulfing patterns, clean movement beforehand is useful for decision making.
Clean downward price moves to precede a bullish engulfing pattern or clean upward movement before a bearish engulfing pattern. In a choppy, uncertain market, engulfing is a less significant signal.
Rising Wedge
The rising wedge pattern is sometimes known as an ascending wedge. This pattern is ascertained when a bullish trend is occurring.
When lines are drawn from the lowest price and the highest price, they will converge at some point and create an ascending wedge shape.
The pattern will usually take between 10 to 50 periods to develop and are useful indicators that there might be a reversal in the market, a bearish reversal in the case of a rising wedge.
To spot a rising wedge, identify converging trend lines combined with a pattern of declining volume which is likely to lead to a breakout from one trend line.
A falling wedge pattern is the opposite. This means a bearish trend is occurring and the convergence of trend lines form a descending wedge. This can be a reliable indicator that a bullish reversal is about to happen.
According to traders, the wedge patterns often break in the opposite direction of the trend lines.
If the wedge is rising, make bearish trades. If it is falling, it is a good time to make bullish trades.
Studies show that the wedge is an indicator of a breakout reversal about two thirds of the time; however, the falling wedge might be more reliable than the rising.
Head and Shoulders
A head and shoulders pattern describes the image of three peaks that resembles a head and shoulders.
This has a baseline where the two outside peaks are similar in height, while the middle peak is the highest and predicts a bullish-to-bearish trend reversal.
The structure of the head and shoulders pattern is a short change in prices that is considered a tremendously reliable trend reversal pattern.
A bullish trend leads to a peak, followed by a bearish trend and a trough. A stronger bullish trend leads to a substantially higher peak and then a bearish trend to another trough. The third peak demonstrates a less strong bullish trend to a quick bearish trend.
This is a trading signal that can demonstrate a bullish period is coming to an end, and a bearish trade is about to take over.
Inverted Head and Shoulders
In broad terms, an inverted head and shoulders is the direct opposite of the above, sometimes known as a head and shoulders bottom. It is recognized by traders as singling a reversal to a bull market.
Investors make the best use of the head and shoulders pattern when they choose to trade around the neckline. This describes a connection between the swing lows (on a head and shoulders pattern) or the swing highs (on an inverted head and shoulders pattern).
Any move past the neckline is enough to suggest that a reversal might be underway. Therefore, making trades once the price rises above the resistance of the neckline is the best action.
Final Thoughts
While most trading involves reacting to price action, there are specific strategies that relate to price action trading.
It is a short to medium-term trading strategy that relies on volatility to make trades and involves the trader being able to ‘read the market’ to make the best decisions.
The technical analysis needed to create graphs and plot movements of prices can be used to decide on when to trade and whether to buy or sell. This is thanks to the recognition of certain patterns that could indicate a reversal in the current market trend, whether that be bullish, bearish or flat.
In a bull market, buying is driving the prices up. In a bear market, selling is driving prices down. In a flat market, there is little movement or volatility and therefore, it is harder to trade for profit.
To be successful at price action trading, discover order in what appears to be random movements of the reduction in the asset to understand what can cause market volatility and be prepared for that.
Whether there is economic or political news, rumors or even a natural disaster, a volatile market makes higher value trading possible.
Price action trading is a popular strategy for many traders because it is simple to backtest and has been a reliable strategy over time.
WikiJob does not provide tax, investment or financial services and advice. The information is being presented without consideration of the investment objectives, risk tolerance or financial circumstances of any specific investor and might not be suitable for all investors. Past performance is not indicative of future results. Investing involves risk including the possible loss of principal.
76% of retail investor accounts lose money when trading CFDs with eToro. You should consider whether you understand how CFDs work, and whether you can afford to take the high risk of losing your money. Don’t invest unless you’re prepared to lose all the money you invest. This is a high-risk investment and you should not expect to be protected if something goes wrong. Take two mins to learn more.